A stenopterygius fossil. Photo courtesy Wikipedia
In 1981, when I was nine years old, my father took me to see Raiders of the Lost Ark. Although I had to squint my eyes during some of the scary scenes, I loved it – in particular because I was fairly sure that Harrison Ford’s character was based on my dad. My father was a palaeontologist at the University of Chicago, and I’d gone on several field trips with him to the Rocky Mountains, where he seemed to transform into a rock-hammer-wielding superhero.

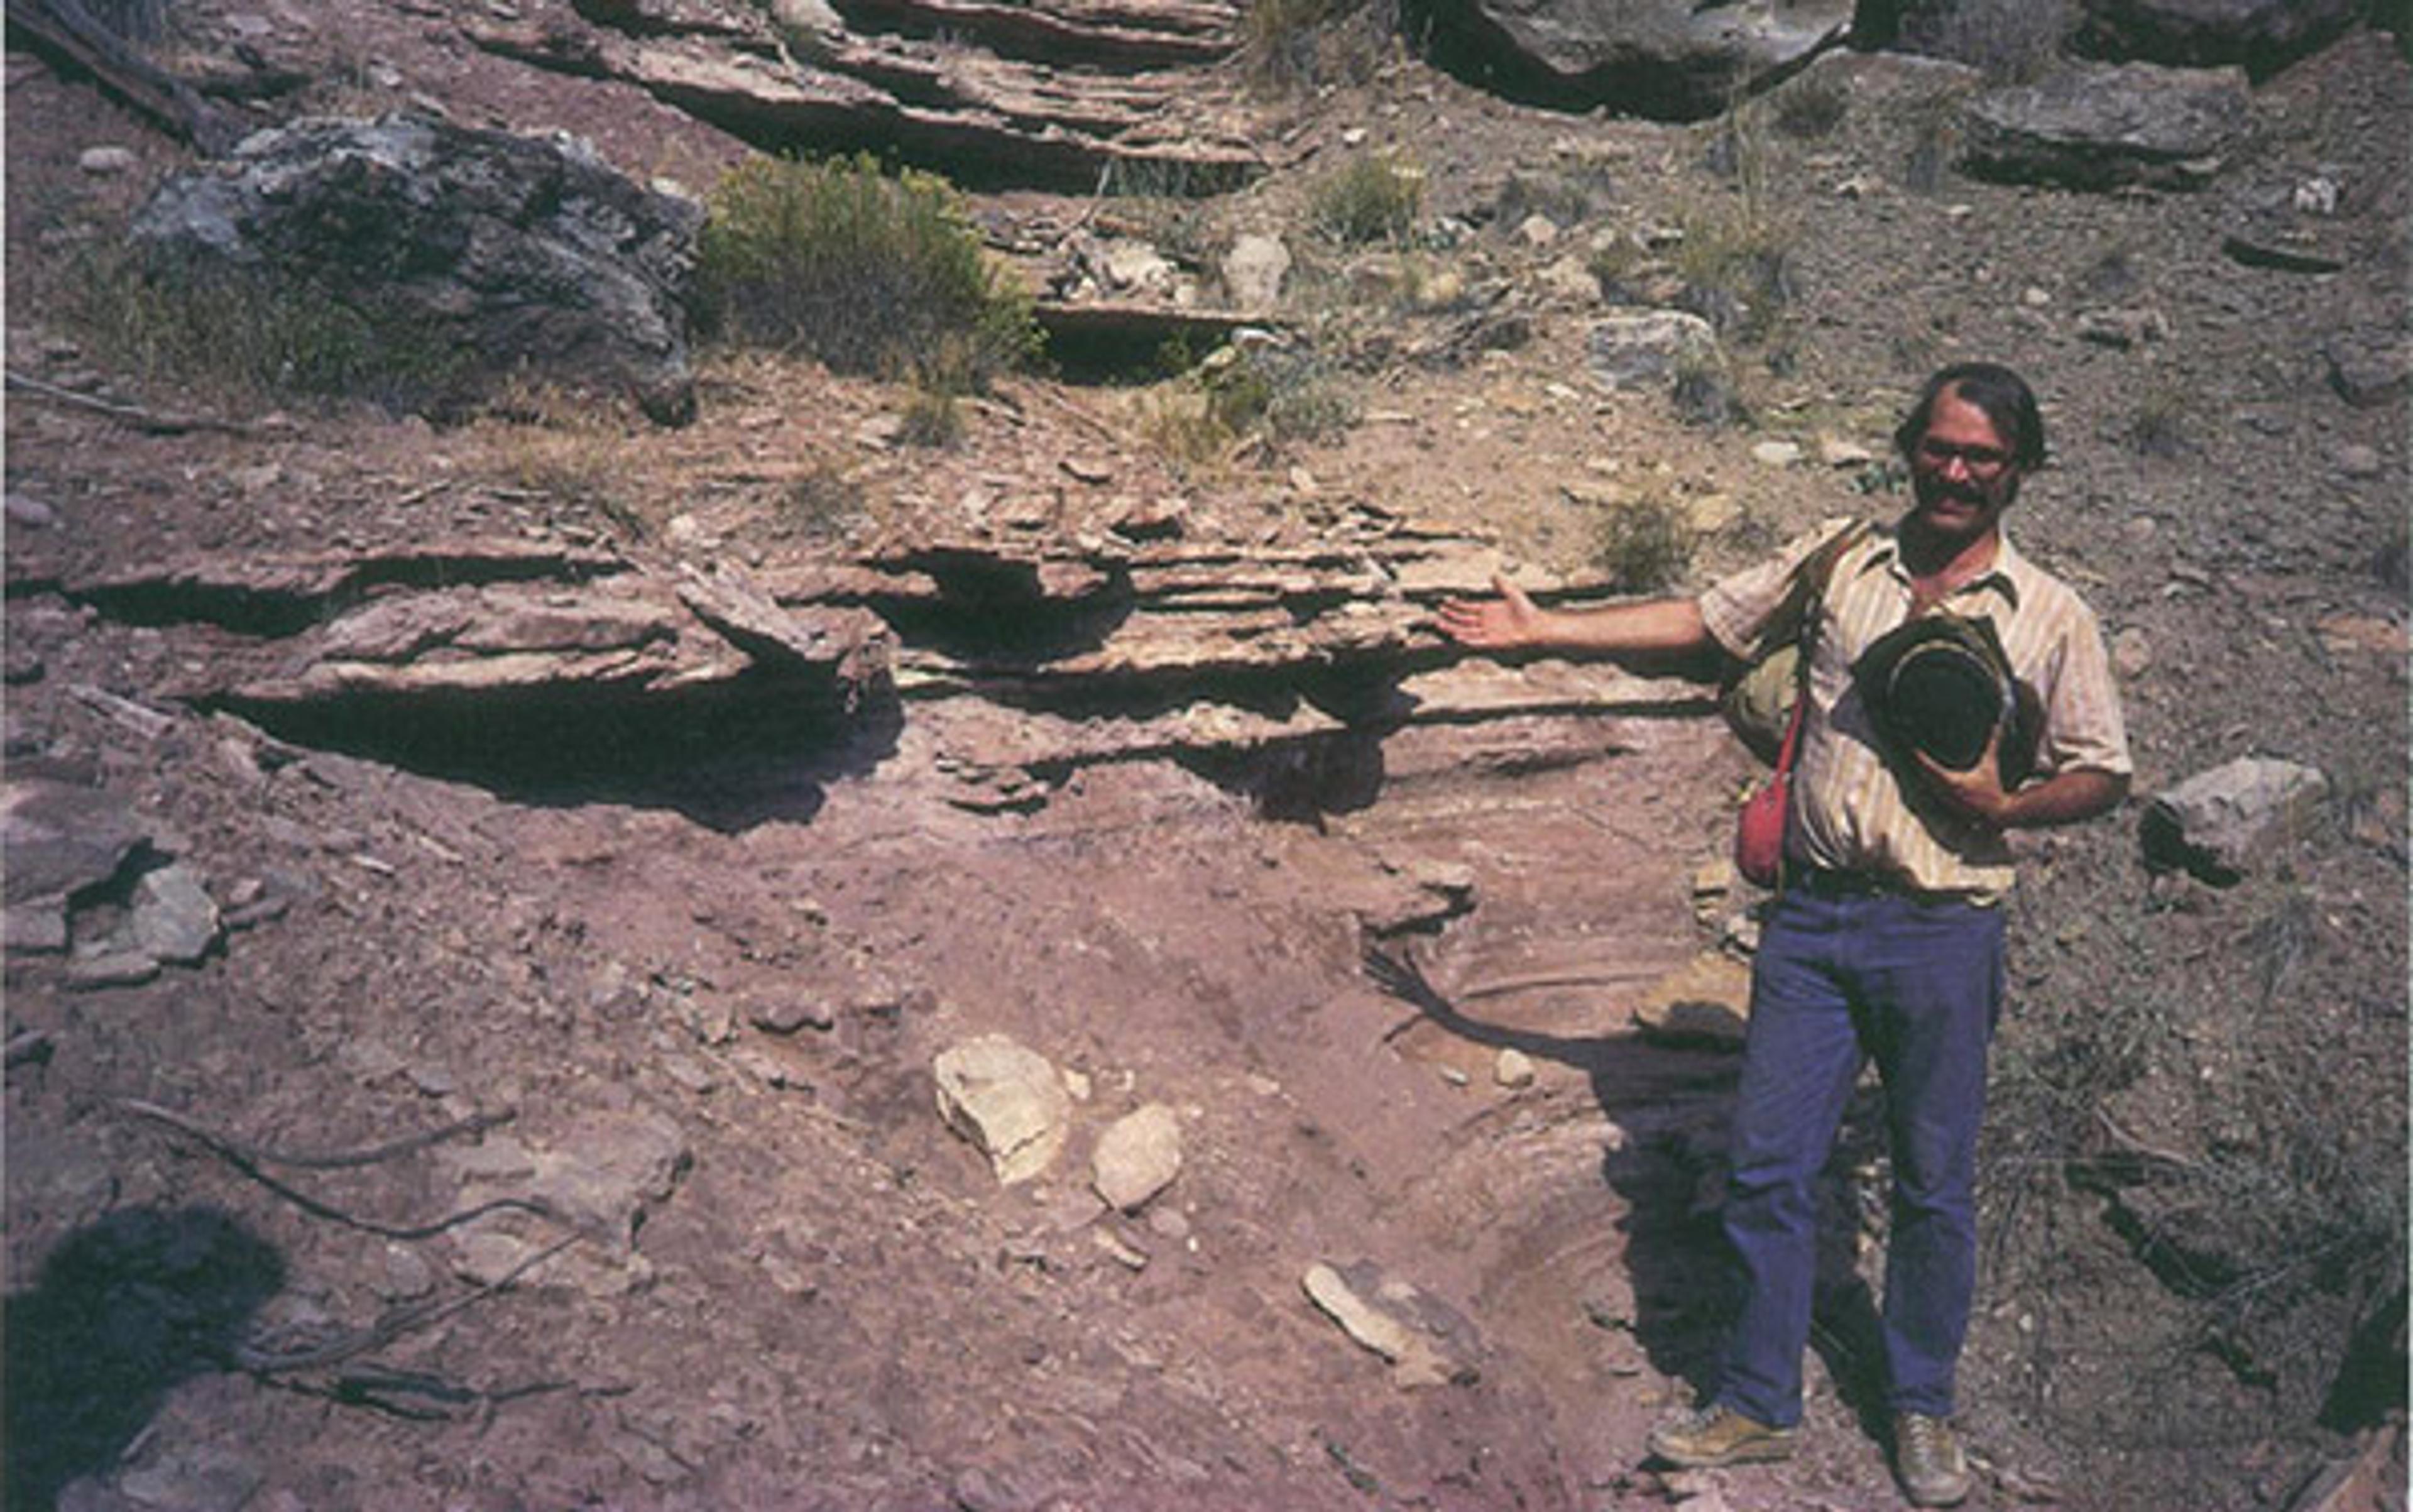
The author’s father, Jack Sepkoski in the field. All images courtesy the author.
That illusion was shattered some years later when I figured out what he actually did: far from spending his time climbing dangerous cliffs and digging up dinosaurs, Jack Sepkoski spent most of his career in front of a computer, building what would become the first comprehensive database on the fossil record of life. The analysis that he and his colleagues performed revealed new understandings of phenomena such as diversification and extinction, and changed the way that palaeontologists work. But he was about as different from Indiana Jones as you can get. The intertwining tales of my father and his discipline contain lessons for the current era of algorithmic analysis and artificial intelligence (AI), and points to the value-laden way in which we ‘see’ data.
My dad was part of a group of innovators in palaeontology who identified as ‘palaeobiologists’ – meaning that they approached their science not as a branch of geology, but rather as the study of the biology and evolution of past life. Since Charles Darwin’s time, palaeontology – especially the study of the marine invertebrates that make up most of the record – involved descriptive tasks such as classifying or correlating fossils with layers of the Earth (known as stratigraphy). Some invertebrate palaeontologists studied evolution, too, but often these studies were regarded by evolutionary biologists and geneticists as little more than ‘stamp collecting’.
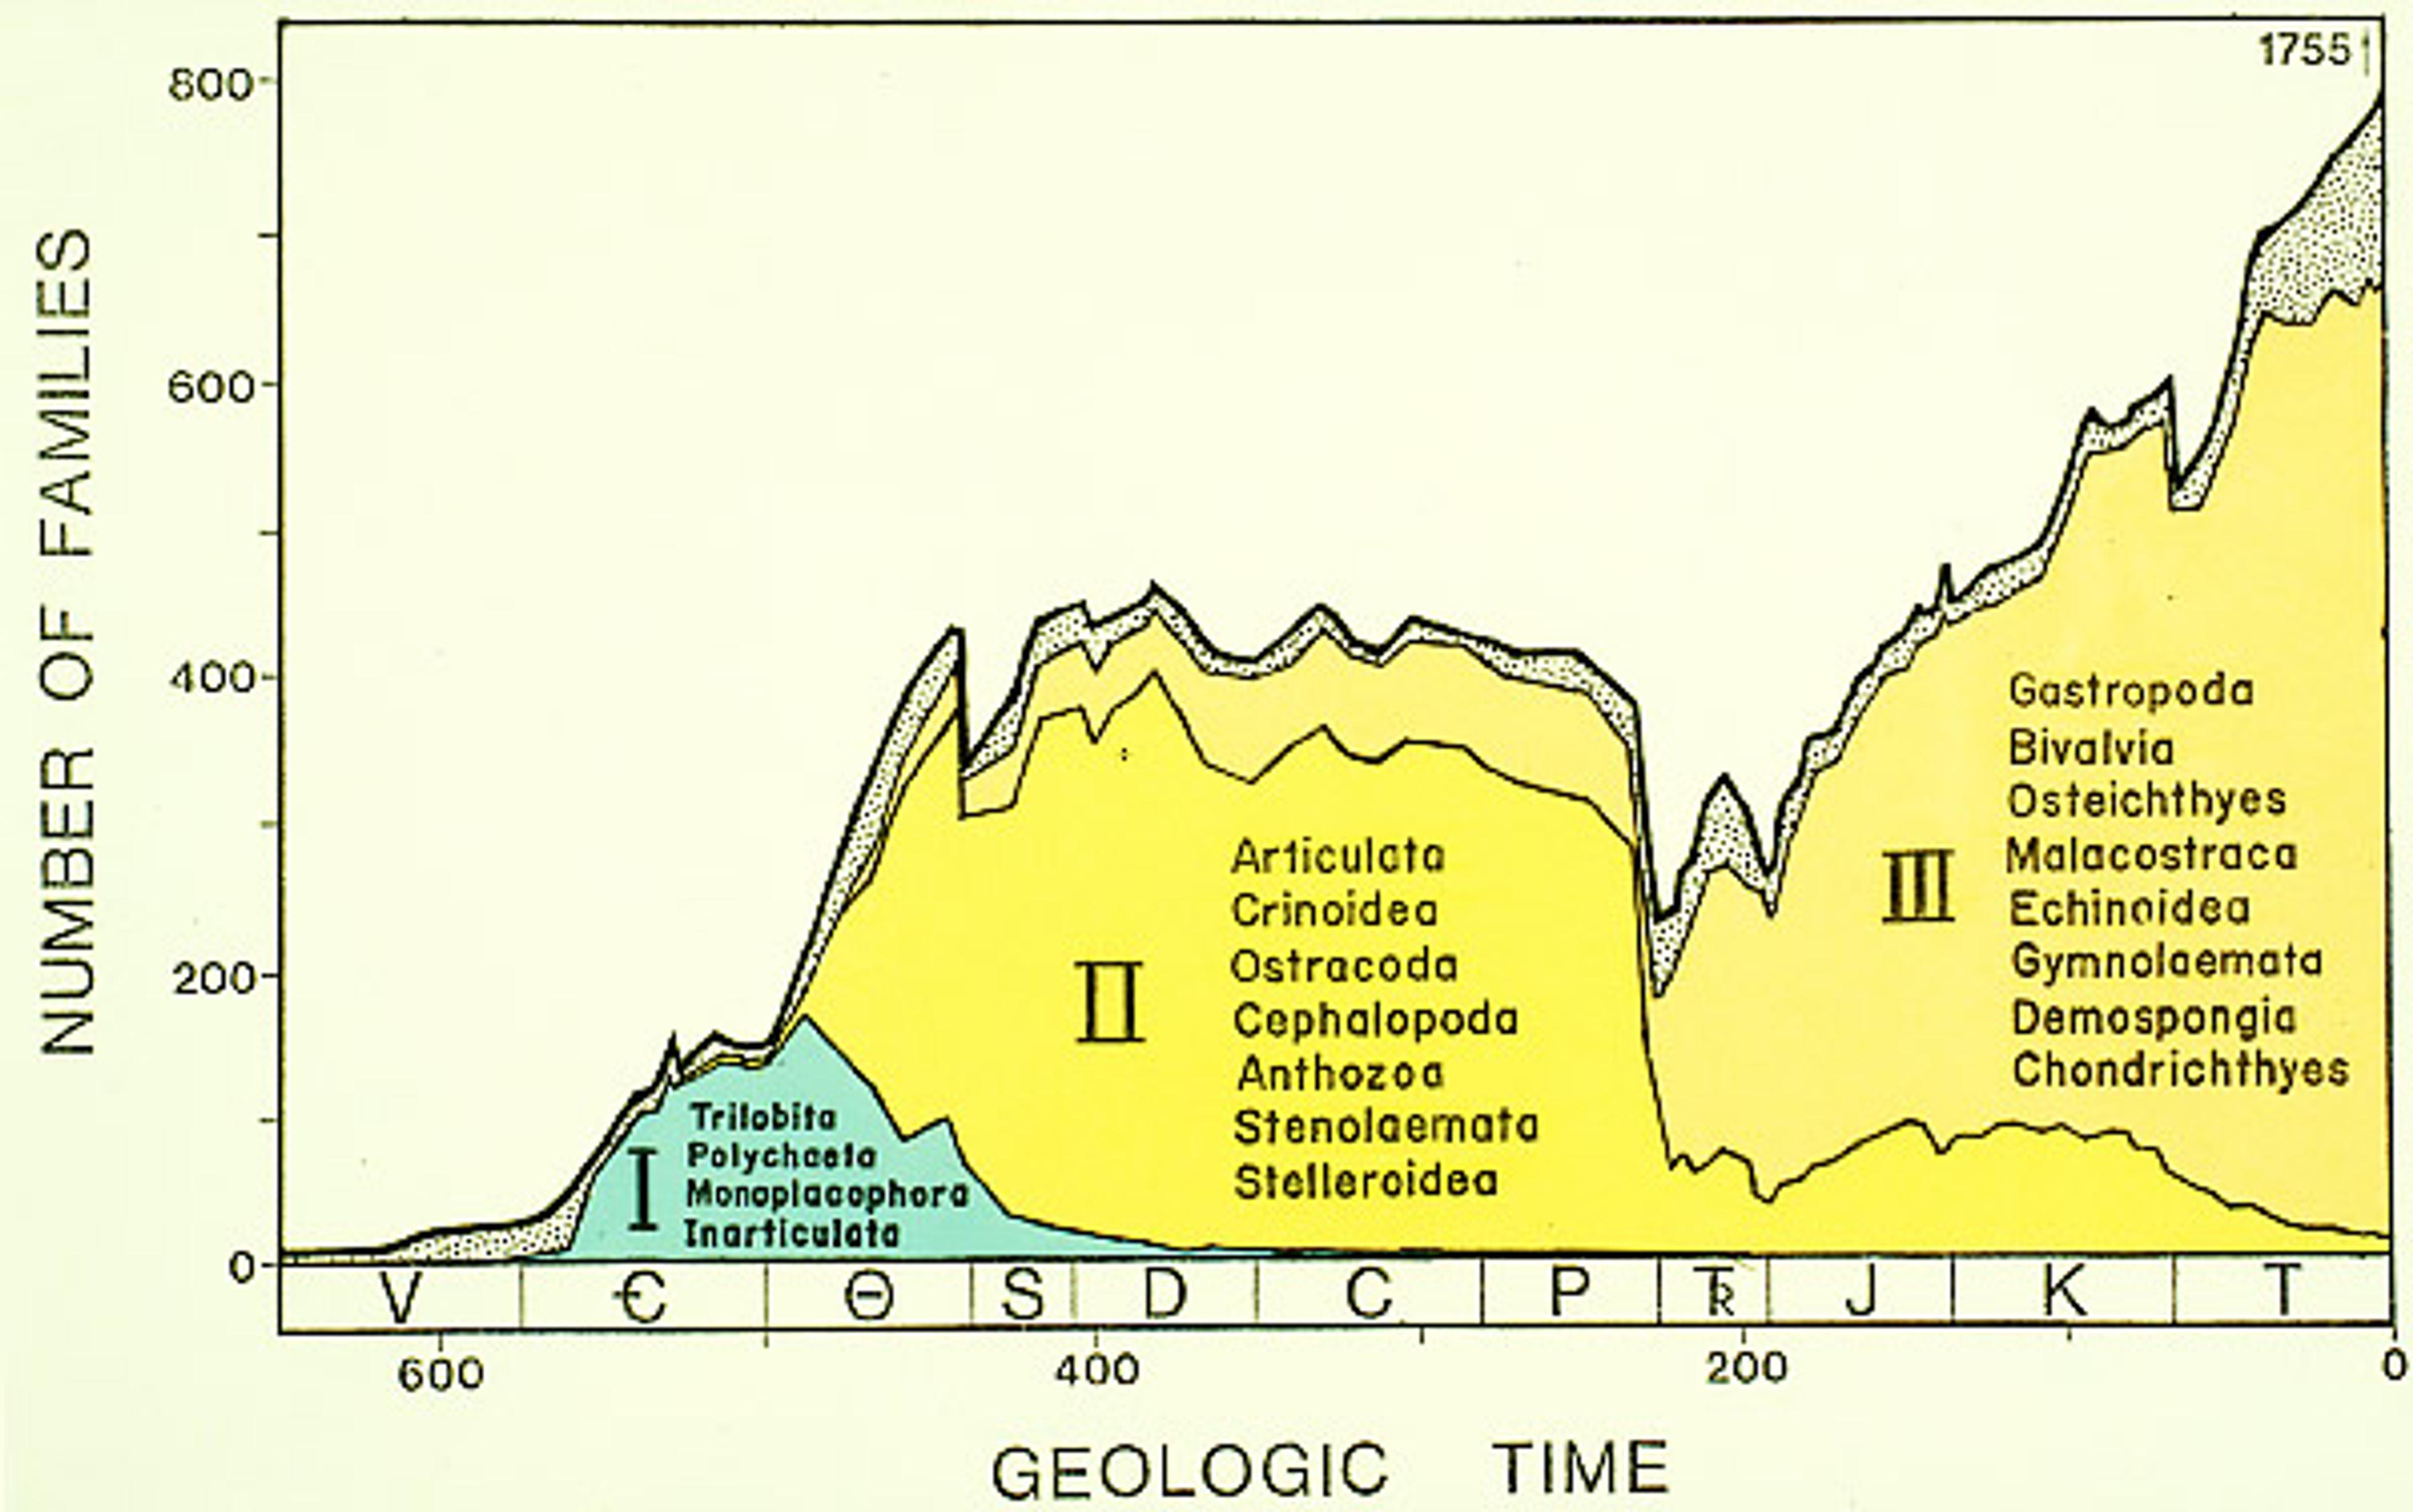
The use of computers to analyse large data sets changed this image – particularly because it allowed palaeontologists such as my dad, and his colleague David Raup at the University of Chicago, to expose patterns in the history of life that emerged only on very long timescales. One of their signature contributions was the discovery that life has experienced major, catastrophic mass extinctions at least five times in the Earth’s history (this is why many people now refer to the current biodiversity as the ‘sixth extinction’).
By the mid-1980s, what began as a small, iconoclastic movement had achieved fairly stunning success. A vindicating moment came, in 1984, when the English geneticist John Maynard Smith – notoriously skeptical of palaeontology’s value to evolutionary analysis – published an essay in Nature in 1984 inviting palaeontologists to the ‘high table’ of evolutionary biology (a reference to the Oxbridge practice of seating fellows and professors on a raised platform in the dining hall).

A graph of mass extinction.
The analytical, data-driven palaeobiology pioneered by my father has now become a cottage industry. Much like algorithms are used in genomics to automate data analysis, a group of researchers at the University of Wisconsin-Madison, for example, recently announced a project called ‘PaleoDeepDive’ – a ‘statistical machine-reading and learning system, to automatically find and extract fossil-occurrence data from the scientific literature’. Palaeobiology’s success has paralleled the advent of computing and the internet, and would seem like an obvious example of the determining impact of technology on science.
The real story is somewhat more complicated, however. My father and his colleagues did not, in fact, ‘invent’ the practice of analysing the history of life using data. That approach was introduced long before the advent of computers, as far back as the 1830s and ’40s, when the discipline of palaeontology was still brand-new.
One of the first scientists to explore life’s history with data was the 19th-century German palaeontologist Heinrich Georg Bronn. During his lifetime, Bronn was one of the leading naturalists in Europe; his posthumous fame is connected to his status as one of the first translators of Darwin’s On the Origin of Species (1859). But an intriguing feature of Bronn’s work is that he treated the history of life as a history of data. Much as palaeontologists do today, he painstakingly amassed something akin to a huge, paper ‘database’ of fossil groups, which allowed him to perform quantitative analysis of populations over time. What he found was that the history of life, seen through data, reveals a grand pattern of dynamic succession: as some groups of organisms ascended and thrived, others passed away to extinction, apparently in a coordinated fashion.
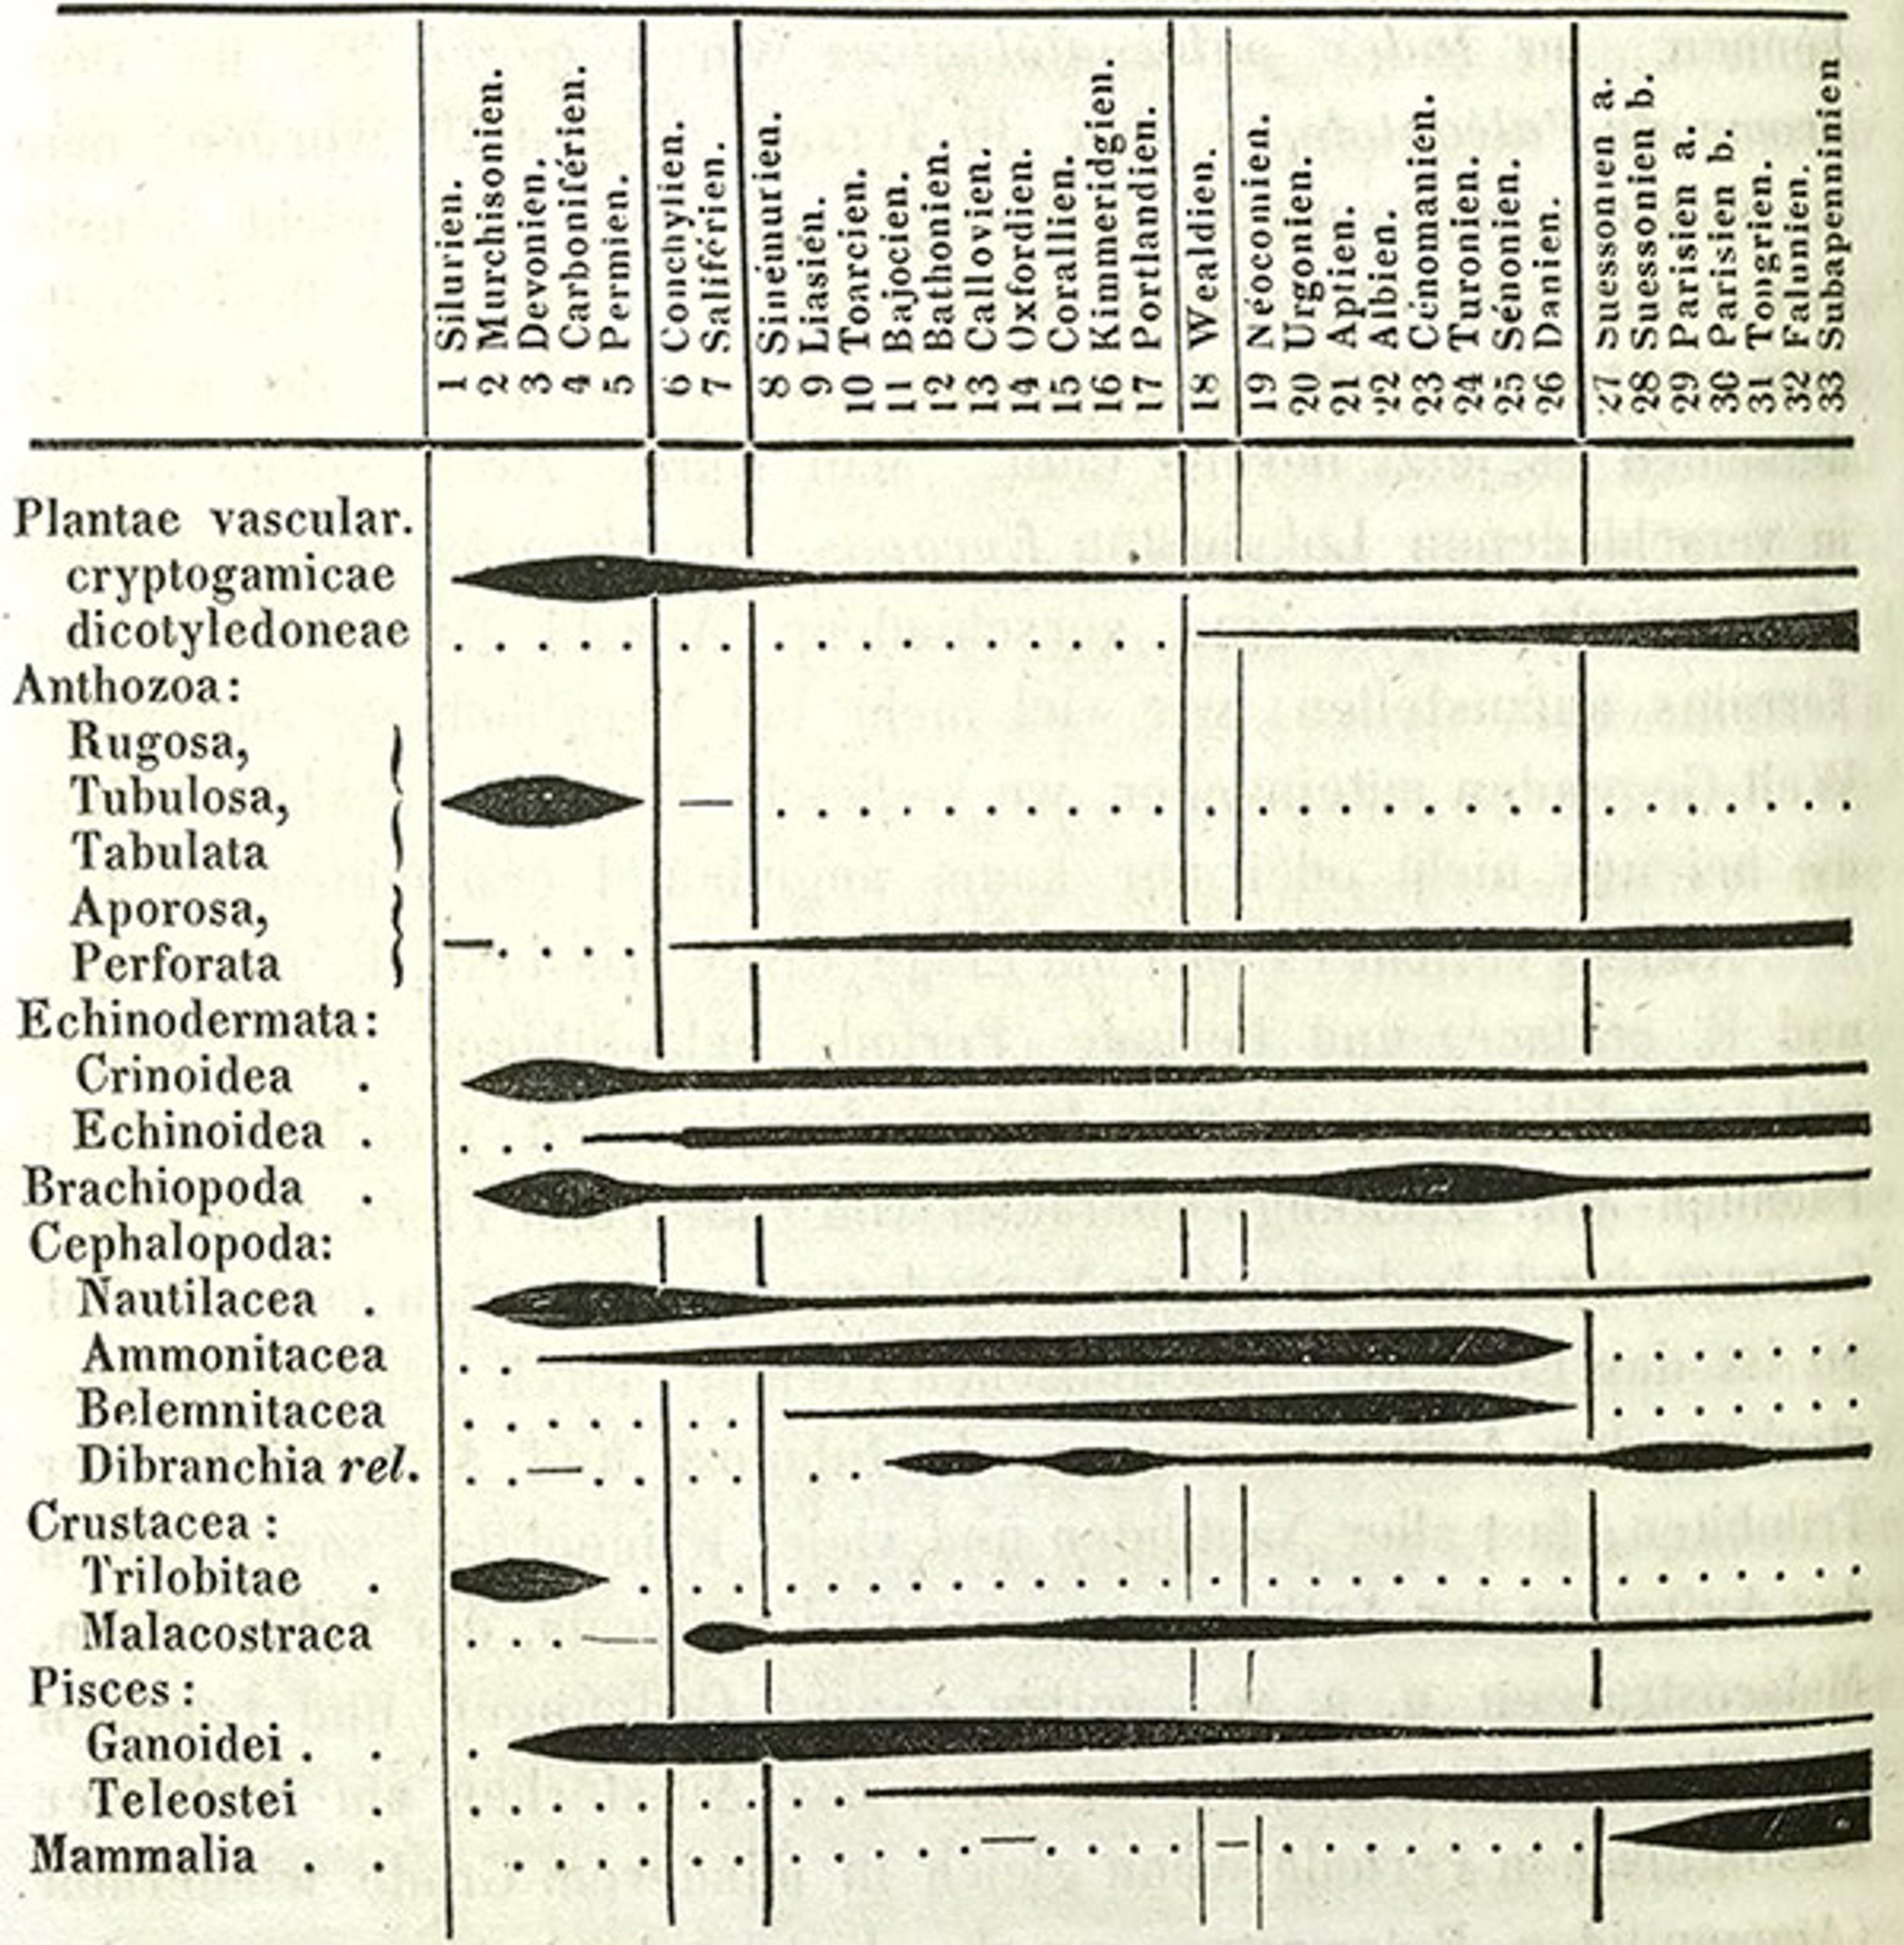
Bronn presented his theoretical case by marshalling his evidence in many hundreds of pages of data tables and statistical summaries. While several other naturalists of the early 19th century also pursued a numerical approach to taxonomy, Bronn took it further than anyone else, and championed it as a new methodology for palaeontology. Along with his statistical tables, Bronn also presented innovative visualisations of his data in the form of what are now called ‘spindle diagrams’. These depict changes in the diversity of a higher taxonomic unit (say, a family) as a line whose thickness varies depending on the number of species or genera it contains at a given time.

Bronn’s graph.
If this approach is so old, why were palaeontologists treated like ‘stamp collectors’ for so long, and why was modern palaeobiology considered ‘revolutionary’? Computers do have an important role in this story, but one that’s not necessarily as determinative as it seems at first glance. While Bronn and others advocated for an analytical approach throughout the 19th century, it failed to catch on. Some palaeontologists objected to making broad theoretical claims based on what was (admittedly, at the time) a very fragmentary record; others rejected the data-driven approach because its results often clashed with the Darwinian expectation of gradual, unbroken evolutionary development (pointing instead to an irregular tempo in the development of life).
But modern palaeobiology succeeded where Bronn and others failed, for two reasons. First, by the 1970s some biologists – and especially palaeontologists such as Stephen Jay Gould – had become much more receptive to challenging Darwin’s gradualist evolutionary assumptions. Gould (who was my father’s graduate mentor at Harvard University) promoted a theory of ‘punctuated equilibria’ – the insight that lineages persist for long stretches with very little change, ‘punctuated’ by periods of rapid evolution. Likewise, the mass extinctions documented by my father and others led to a revision of the Darwinist belief that the diversity of life has been basically stable throughout geological history.
Secondly, and more broadly, culture has changed significantly. Yes, computers have allowed faster and more powerful statistical analysis than what was possible with pen and paper. But even more fundamentally, they have changed how we ‘see’ data. In the earlier 19th century, graphs such as Bronn’s (or other kinds of visualisations, such as line graphs) were relatively novel, and their ubiquity not yet established. Yet in our own time, it’s taken for granted that the best way of understanding large, complex phenomena often involves ‘crunching’ the numbers via computers, and projecting the results as visual summaries.
That’s not a bad thing, but it poses some challenges. In many scientific fields, from genetics to economics to palaeobiology, a kind of implicit trust is placed in the images and the algorithms that produce them. Often viewers have almost no idea how they were constructed. The complexity of computers has made data-analysis a black-box, something it’s hard for humans to peer into. At the same time, computer jockeys such as my dad have achieved a new cultural status – if not quite Indiana Jones, they still have a kind of power and authority most of us can’t access.
Increasingly, with the advances in machine-learning and AI, even those authorities are sometimes mystified by how their algorithms work. Indeed, there are many palaeontologists who are concerned that more traditional methods – developing deep familiarity with past organisms or environments – have been eclipsed by the lure of easy results and quick publication offered by data-crunching. The stakes for this one scientific discipline might seem fairly low, but in an age of molecular genomics and Google analytics, for the rest of us they couldn’t be higher.


